Javascript API
/ Getting Started with the MapLarge Javascript API
Content
- Getting Started
- Creating JSON with Map Editor
- Creating a Map
- Creating a Layer
- Filtering Layer Data
- Styling Layer Data
- More Examples
Getting Started
The MapLarge Javascript API is a client side library used to create maps and layers. The API interacts with MapLarge web services and runs on top of many other mapping APIs including Google Maps, Leaflet, and ESRI.
Simple Getting Started Example
Loading the MapLarge API
To load the MapLarge API, simply include the MapLarge javascript file.
In the script tag is a URL with the location of the file that contains the MapLarge JS API. This script tag is required.
Note: If directed to a specific MapLarge server, specify it in the URL.
Creating JSON with Map Editor
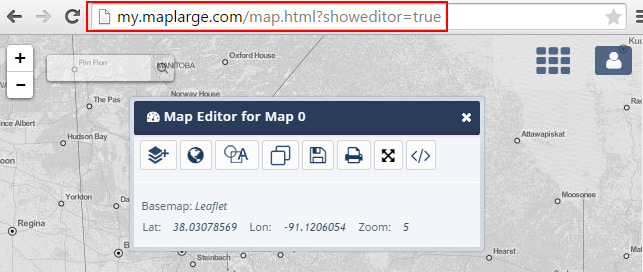
Almost all MapLarge API calls can also be configured without coding by using the advanced MapEditor.
Use MapEditor to create and edit maps and layers or for capturing code snippets for use in custom JavaScript.
Open MapEditor by adding ?showeditor=true to the map URL. MapEditor can also be opened by pressing CTRL + BACKSPACE.
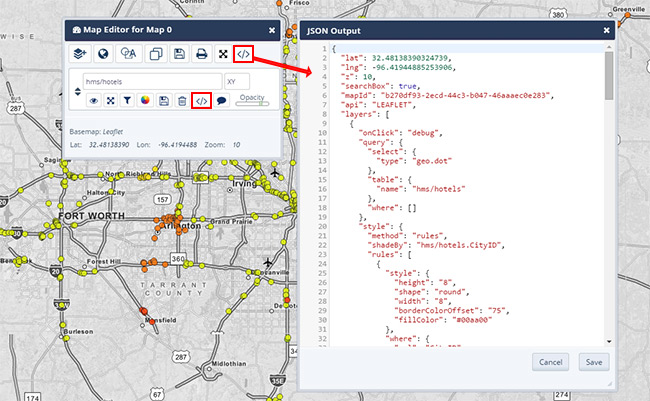
The JSON object shown in the Map or Layer JSON editor is simply a valid options object that may be passed into the constructor for a map or layer.The Map JSON Includes attributes including the basemap, zoom level, map center position and all included Layers. The Layer JSON only includes JSON relevant to that specific layer.Access the JSON by pressing the View/Edit JSON button on a Map or Layer in MapEditor.
Creating a Map
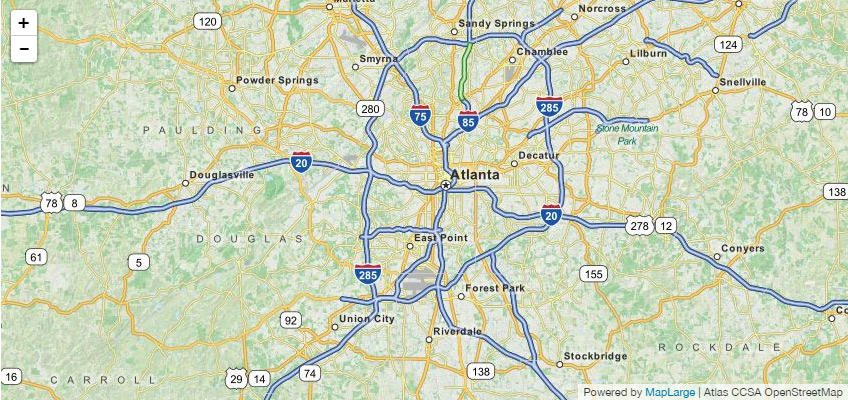
This example shows how to create a map with a specific latitude, longitude, and zoom. The map object is used in the examples below. More details about map options can be found here.
Creating a Map Example
Example Map
Creating a Layer
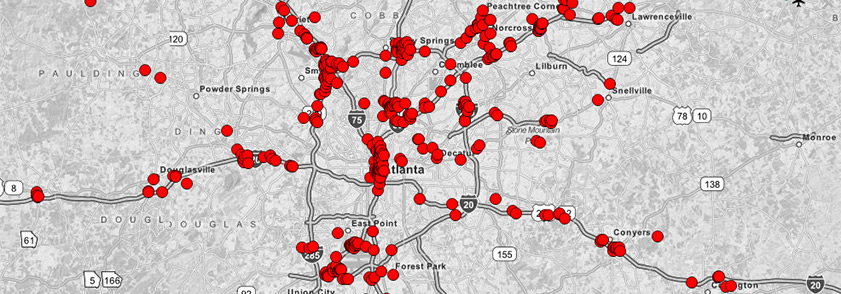
Layers also have their own set of options, similar to maps. This example creates a dot layer from the table "hms/hotels".
Creating a Layer Example
Example Map
Filtering Layer Data
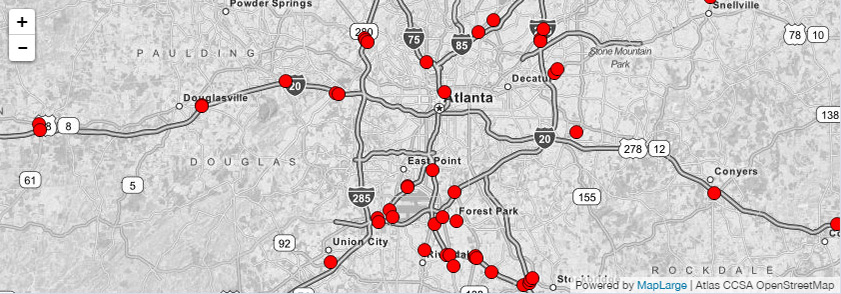
This is the same layer object but now filtering options have been added. This layer will only show hotels with a cost less than $50.
Learn more about the MapLarge Where Clause.
Creating a Layer with Filtering
Example Map
Styling Layer Data
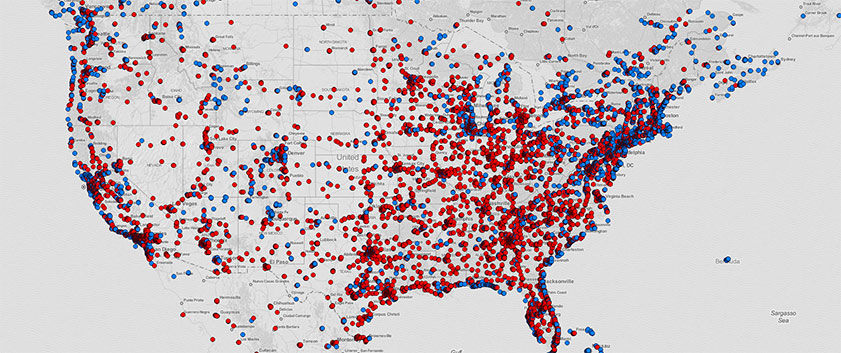
Styling options can be added to a layer. This example shows hotels under $100 as red points and hotels over $100 as blue points.
Styling Data Example
Example Map
Complete Code Example with Filters and Styles
More Examples
Looking at examples is a great way to get more comfortable with what is possible with our API. You can press ctrl + M on any of these example maps to open up Map Editor so you can look at the JSON that was used to create that map.
Maps
/ Maps - Quick Start
Map Container
Each map is contained within a div (or other block level element) on the page.
Note: Width and height must be set for the container because the map object itself has no minimum width or height and will stretch to fill the container. When a container has no width or height the map will not appear.
Map Object
A map object is the data object that controls all the properties of a displayable map, including starting locations, zoom levels, rendering options, underlaying map tiles, and more.
The first parameter can either be an ID or DOM element. The second parameter is a map's options object.
Create Javascript map object and pass to the div element.
Example Map
Note: If the map container element is being created statically on the page then using a div is not necessary. Use the following to create the actual map data object:
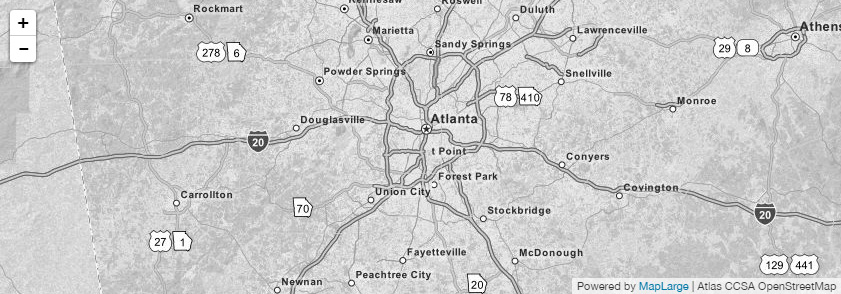
Basemaps
MapLarge is drop in compatible with other mapping providers. If no API is defined in the map options, the default basemap is Leaflet. Each API has various baselayer options. For example, Leaflet provides the baselayers:
Color
OSM Dark
Blue Marble
Aerial
Satellite
Blank (white)
Creating a Map Example
Accessing the Underlying Mapping API
In addition to the options provided by the MapLarge Map object, the underlying mapping provider API options and features are also available (Google, Leaflet, or ESRI). These can be referenced by using map.getInternalMap().
Alternative Advanced Constructor
The MapLarge API can also attach to a Google or other map that already exists on the page.
//maplarge.com/googlemapsapi.
Maps
/ Map Constructor Options
Each map is contained within a div (or other block level element) on the page.
Maps - Quick Start
Maps - Quick Start
Maps - Quick Start
Maps - Quick Start
Maps - Quick Start
Maps - Quick Start
Maps - Quick Start
Maps - Quick Start
Maps - Quick Start
Maps - Quick Start
Maps - Quick Start
Maps - Quick Start
Maps - Quick Start
Maps - Quick Start
Maps - Quick Start
Maps - Quick Start
Maps - Quick Start
Maps - Quick Start
Maps - Quick Start
Maps - Quick Start
Maps - Quick Start
Maps - Quick Start
Maps - Quick Start