
In this white paper we will examine the performance of MapLarge API tile servers under real world load scenarios. We will also quantify some typical consumer use cases and estimate server requirements for a typical multi user load.
 Real world usage of web maps will vary greatly by the type of map and the purposes of the user. However, our observations indicate consumer map usage patterns tend to fall in a predictable range across many sites. Simple, single layer maps like a Bing or Google map of streets will require fewer resources and engage the user less than more complex mashups like those at Zillow.com or the MapLarge API site HotelMapSearch.com, but in each case usage can be measured and predicted. Early web maps were closely modeled on older desktop applications and utilized specialized JavaApplets to render dynamic maps. As the internet matured web map developers gravitated towards lighter, faster, standards compliant html based applications that use JavaScript, Flash or SilverLight to render external resources (JPG, PNG, JSON, XML, etc.) into an interactive map. A modern web map uses a web browser to make http requests to remote web server(s) to render the initial map view and make additional http requests as the user interacts with the map. While these many of these requests occur behind the scenes after the initial html page loads, the map components must load quickly in order to avoid a Bad User Experience.
 //0api.maplarge.com/Tile/Tile?
x=4&y=6&z=4&filter=
&layer=geo~dot~XY
|data~hotels~LowRate
&shader=method~interval
|colors~LightBlue/Blue,Blue/Red
|ranges~50/125,100/300
|dropShadow~true
|textPre~x/3,y/3,size/9,text/$
|text~round/0,x/8,y/3
|shape~rectangle
|fixedHeight~14
|size~30
|count~300
In the test below 25 external http clients hit a single core Azure instance as rapidly as possible. The test uses random unique tile requests so that every tile was dynamically generated and all requests are focused in the zones where data is the thickest. All work is preformed by the single instance: There is no database server and no tiles are pre-cached. The instance ran under a sustained load for 3 hours and achieved constant throughput of 100 to 150 requests for every sample during the entire period. Below is a chart an example sample period.
//0api.maplarge.com/Tile/Tile?
x=4&y=6&z=4&filter=
&layer=geo~dot~XY
|data~hotels~LowRate
&shader=method~interval
|colors~LightBlue/Blue,Blue/Red
|ranges~50/125,100/300
|dropShadow~true
|textPre~x/3,y/3,size/9,text/$
|text~round/0,x/8,y/3
|shape~rectangle
|fixedHeight~14
|size~30
|count~300
In the test below 25 external http clients hit a single core Azure instance as rapidly as possible. The test uses random unique tile requests so that every tile was dynamically generated and all requests are focused in the zones where data is the thickest. All work is preformed by the single instance: There is no database server and no tiles are pre-cached. The instance ran under a sustained load for 3 hours and achieved constant throughput of 100 to 150 requests for every sample during the entire period. Below is a chart an example sample period.
 In the test below 100 external http clients hit a single core Azure instance as rapidly as possible. All requests were for a tile in cache. However, each http request included a unique extra variable in their query string to force a cache analysis and full client-to-server http round trip (no interim network or CDN caching).
 As we saw above, load profiles can vary considerably from application to application, but a typical consumer map load will generate in the neighborhood of 10 requests per second during active sessions when the user is engaged with the map to complete a task. The metrics above indicate that a single core Azure instance can support over 100 dynamic requests per second and over 700 cached requests per second. Dividing that by 10 requests per second per user that means a small Azure instance can support up to 10 (totally dynamic) and 70 (totally cached) active sessions without the support of a CDN or other load balancer. How many requests are served from cache vs. dynamically will vary with usage patterns but it is common in consumer applications to see more than 50% of requests served from cache. The system scales linearly across processors in the Azure instance family and duplicate instances can be cloned and deployed automatically or manually with a few clicks.
This concludes our performance white paper. For further reading try our detailed article on user experience, or contact us at info@MapLarge.com if you have specific questions.
As we saw above, load profiles can vary considerably from application to application, but a typical consumer map load will generate in the neighborhood of 10 requests per second during active sessions when the user is engaged with the map to complete a task. The metrics above indicate that a single core Azure instance can support over 100 dynamic requests per second and over 700 cached requests per second. Dividing that by 10 requests per second per user that means a small Azure instance can support up to 10 (totally dynamic) and 70 (totally cached) active sessions without the support of a CDN or other load balancer. How many requests are served from cache vs. dynamically will vary with usage patterns but it is common in consumer applications to see more than 50% of requests served from cache. The system scales linearly across processors in the Azure instance family and duplicate instances can be cloned and deployed automatically or manually with a few clicks.
This concludes our performance white paper. For further reading try our detailed article on user experience, or contact us at info@MapLarge.com if you have specific questions.
Outline
I. Why Response Times Matter
II. What is a "Real World" load?
III. Delivering Fast Maps
IV. Dynamic Response Tests
V. Cache Response Tests
VI. Load Capacity Conclusions
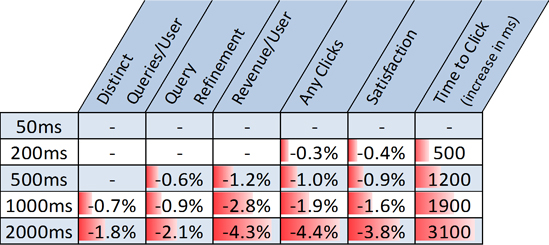
This article will explain how to deliver quick, responsive maps. Before we begin that discussion, we would like to briefly mention why improving the response times experienced by users is important. The chart below illustrates the costs of a single slow response time. Imagine the compounding frustration users experience as they struggle to accomplish a map task that requires numerous slow responses. For more detail see our detailed article on user experience.
The Cost of Being Slow
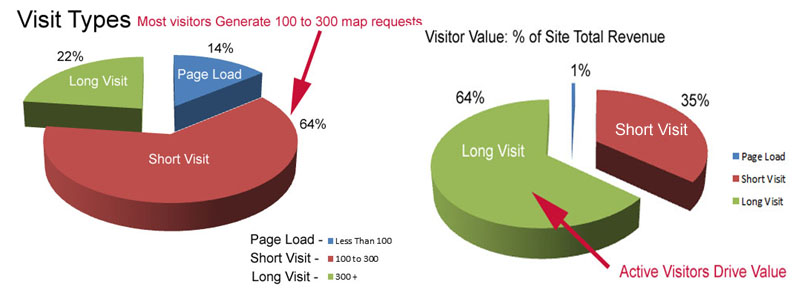
At HotelMapSearch.com, a site powered by the Map Large API, the average visitor requires 290 map resources (map tiles, images, and JavaScript) over the course of a visit. We categorize visitors into three types when conducting load analysis: (1) Page Load Visits, (2) Short Visits and (3) Long Visits. Page Load Users are those users who just land on the page and don't engage with the map. On average Page Load visitors spend under a minute on the site and generate fewer than 100 map requests and less than 1% of revenue. Short Visit Users are those users who use the map to complete one or two brief searches and spend an average of 4.5 minutes on the site. Short Visit Users generate 100 to 300 map requests and more than 30 times the revenue generated by Page Load Visits. Long Visit Users are those users who use the map for extended periods of time to conduct multiple searches. These users spend an average of 12 minutes on the site and generate more than 60 times the revenue generated by Page Load Visits. Long Visit Users generate the majority of load, generate the majority of revenue, and are more likely to be repeat visitors who directly type in the site URL. Long Visit users tend to dig deeper into the map interface with detailed searches that generate unique map views. Quickly serving the dynamic map queries of Long Visit users is a key component of our value add to users and the principal driver of site revenue.
Real world usage of web maps will vary greatly by the type of map and the purposes of the user. However, our observations indicate consumer map usage patterns tend to fall in a predictable range across many sites. Simple, single layer maps like a Bing or Google map of streets will require fewer resources and engage the user less than more complex mashups like those at Zillow.com or the MapLarge API site HotelMapSearch.com, but in each case usage can be measured and predicted. Early web maps were closely modeled on older desktop applications and utilized specialized JavaApplets to render dynamic maps. As the internet matured web map developers gravitated towards lighter, faster, standards compliant html based applications that use JavaScript, Flash or SilverLight to render external resources (JPG, PNG, JSON, XML, etc.) into an interactive map. A modern web map uses a web browser to make http requests to remote web server(s) to render the initial map view and make additional http requests as the user interacts with the map. While these many of these requests occur behind the scenes after the initial html page loads, the map components must load quickly in order to avoid a Bad User Experience.
Page Load - Real World Page Load Times & Response Metrics
The initial map load of a web map typically requires about 30 to 60 http requests. These initial requests consist of a few requests to load the JavaScript, Flash, or SilverLight framework running the map in the browser and dozens of small requests for images and metadata about the initial map view.
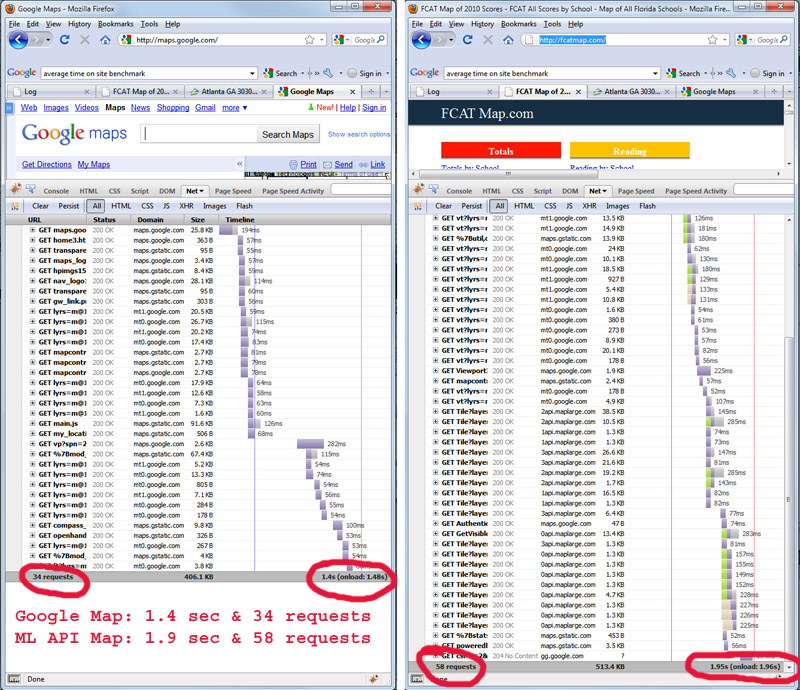
Using browser based tools like Firebug for Mozilla Firefox, measuring the initial page load of a web map is straightforward. Below is a comparison of a simple Google map from maps.google.com on the left and a multi layer education mashup from FCATMap.com which is powered by the MapLarge API. The figure below shows the Google Map loading one set of tiles and FcatMap loading two sets of tiles: dynamic layer of Map Large API tiles, and a base map of Google street tiles. This additional complexity is typical of mashups that sit on top of a street map base layer.
Page Load: Google Plain Base Map (34 requests 1.4 sec load) vs. Map with MapLarge API Data Overlay (58 requests 1.9 sec load)
Dynamic Requests - Expect 10 Requests Per Second Per User
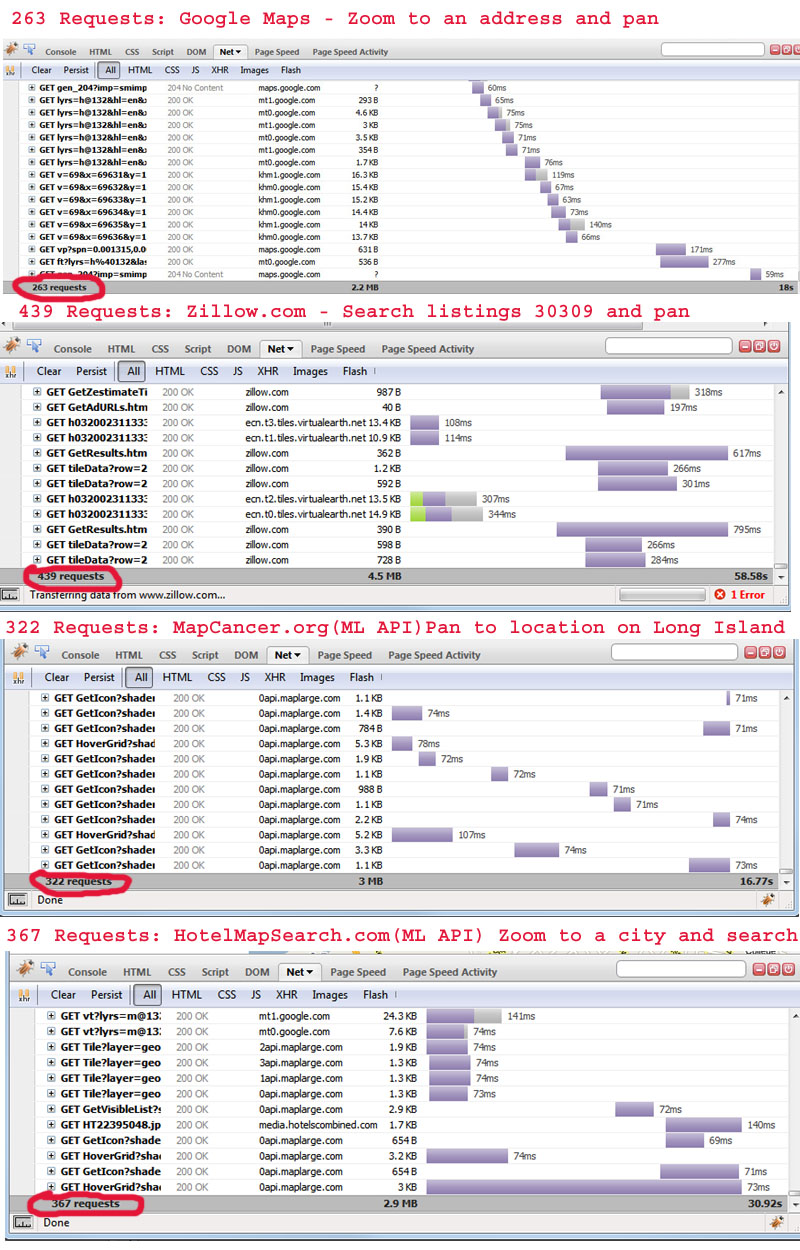
Analysis of the usage patterns of consumer maps hosted on the Map Large API shows that the typical user engages in bursts of panning, zooming and clicking activity. When first engaging with the map, users generate bursts of activity as they pan and zoom to an area of interest and several smaller bursts as they explore a more detailed area and click on items of interest. The level of consumer engagement will vary by use case and the best way to measure is to watch the load generated by users actually engaging with the map. The figure below depicts four example use cases and the http requests involved. In each request the initial page was loaded first and the request log cleared so that the FireBug logs below show the additional http requests created as a result of user interaction with the map. Google Maps and MapCancer made only map related requests and showed fewer requests, and Zillow and Hotel Map Search made additional requests to load content around the map like images of homes or hotels. The average use case session lasted 30 seconds to a minute and involved 300 to 400 requests or an average of about 10 requests per second during an active user session.
Load Created: Hundreds of requests by one user doing a task
Handling the Load - Page Load is Easy - Interactivity is hard
Delivering static content under load is a fairly well understood problem. Most large sites use Content Delivery Networks (CDN) to offload larger static files from their dynamic servers and their dynamic servers also cache content in memory or on disk. This system works well for caching the files needed for the initial load of a map because every user of the page requires the same file and the system can simply cache the files in memory or on a CDN. Caching starts to become problematic as web 2.0 applications allow users to dig into deeper datasets and begin to generate dynamic content queries. Caching every permutation of every unique query could easily swamp the memory and file system limitations of most dynamic and CDN servers. Complex interim solutions are possible, but the ideal solution would be to have dynamic servers fast enough to handle millions of unique queries on the fly.
Estimating Dynamic Load - How many unique requests can we handle?
Delivering fast, interactive maps of large datasets to users is the challenge the benchmarks below address. The dataset used for the test below was a 58mb database of over 140,000 hotels with attributes covering price and other metadata. The icons were dynamically shaded by price using the attribute field "LowRate". Our Web Mercator tile format is compatible with all major base map vendors including Bing, Google and ArcGIS. All info about the map is conveyed in the url and you can experiment with different values here
Example Tile:
//0api.maplarge.com/Tile/Tile?
x=4&y=6&z=4&filter=
&layer=geo~dot~XY
|data~hotels~LowRate
&shader=method~interval
|colors~LightBlue/Blue,Blue/Red
|ranges~50/125,100/300
|dropShadow~true
|textPre~x/3,y/3,size/9,text/$
|text~round/0,x/8,y/3
|shape~rectangle
|fixedHeight~14
|size~30
|count~300
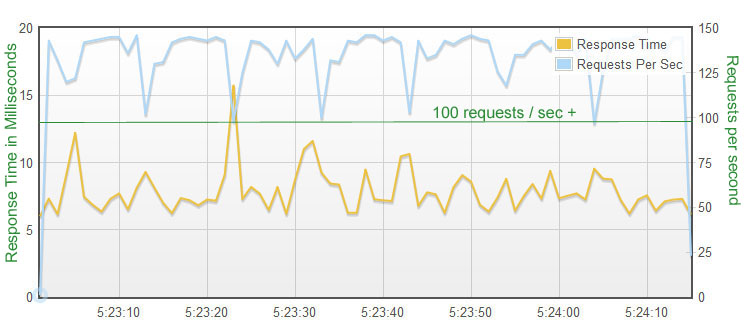
In the test below 25 external http clients hit a single core Azure instance as rapidly as possible. The test uses random unique tile requests so that every tile was dynamically generated and all requests are focused in the zones where data is the thickest. All work is preformed by the single instance: There is no database server and no tiles are pre-cached. The instance ran under a sustained load for 3 hours and achieved constant throughput of 100 to 150 requests for every sample during the entire period. Below is a chart an example sample period.
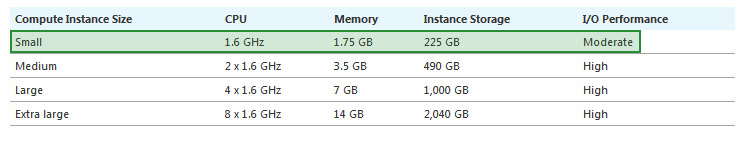
Hardware - Azure Small Instance - Single Core - Hit by external clients over Http
We selected the smallest Microsoft Azure instance for these tests because they represent a nice baseline metric that can be easily monitored and scaled. The specs are as follows below.
Dynamic Tile Server Speed: 100 to 150 Requests Per Second
For this test we monitored and logged CPU, Memory, Http throughput and server errors during a three hour run. Memory usage stayed constant, there were no errors. CPU usage was the bottle neck and http throughput was over 100 requests per second as shown below.
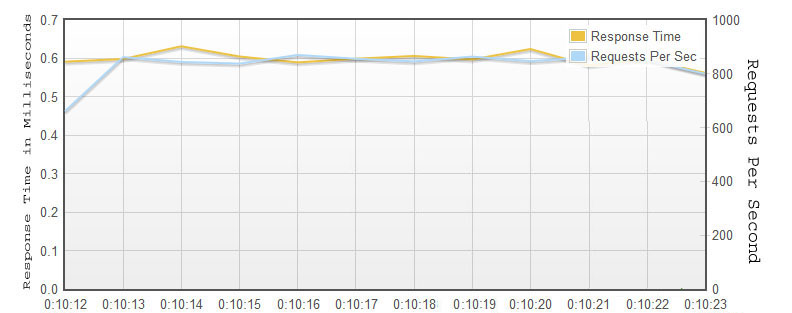
In the test below 100 external http clients hit a single core Azure instance as rapidly as possible. All requests were for a tile in cache. However, each http request included a unique extra variable in their query string to force a cache analysis and full client-to-server http round trip (no interim network or CDN caching).
Hardware - Azure Small Instance - Single Core - Hit by external clients over Http
This test also used a small Azure Instance (see specs above). A CDN or load balancer could also fill the role of handling cache responses in some circumstances.
Requests Per Second During Test: Min: 780 -- Max: 900
As in the sustained test above, memory stayed constant and there were no errors. CPU appeared to be the bottleneck, and throughput was over 780 requests per second.
As we saw above, load profiles can vary considerably from application to application, but a typical consumer map load will generate in the neighborhood of 10 requests per second during active sessions when the user is engaged with the map to complete a task. The metrics above indicate that a single core Azure instance can support over 100 dynamic requests per second and over 700 cached requests per second. Dividing that by 10 requests per second per user that means a small Azure instance can support up to 10 (totally dynamic) and 70 (totally cached) active sessions without the support of a CDN or other load balancer. How many requests are served from cache vs. dynamically will vary with usage patterns but it is common in consumer applications to see more than 50% of requests served from cache. The system scales linearly across processors in the Azure instance family and duplicate instances can be cloned and deployed automatically or manually with a few clicks.
This concludes our performance white paper. For further reading try our detailed article on user experience, or contact us at info@MapLarge.com if you have specific questions.